Dissecting Design: Using Analytics To Drive Web Design Decisions

This month, Digital Firefly Marketing is dissecting design into four parts to learn how to get users from load to goal. How can you get people to click, swipe, sign up or keep reading? We’ve discussed how the look and feel of your site can engage audiences and how thinking about human psychology helps. Today we’re going to jump into the data pool and explore how analytics can drive your decisions about design resulting in higher conversion rates.
Using Analytics To Drive Web Design
Instituting the practices we covered while exploring art and psychology are a great first step. But how do you know if they’re working? Any time you deploy new practices it’s important to include into your process checking analytics. Is what you tried paying off? What if you incorporated other strategies? Analytics can help you understand how your decision affect your target market. Leverage this data when making design decisions and watch your traffic and audience grow even more.
Analytics: Not Simply Tracking Traffic
Designing something that looks pretty is the easy part. The hard part, which is imperative to your goal, is using real live data to drive your design. There’s infinite information at your fingertips telling you how to design for the people who are already visiting your site. It’s your job to harness that information and use it to inform web design.
Demographic Data
Demographics are statistics about a group. Usually they include age, gender, geography but the internet has grown this to include occupation, hobbies, interests and more. When you dig into this data you’re able to get a sense of who you need to attract. So make sure your designing for the audience that is already visiting your website.
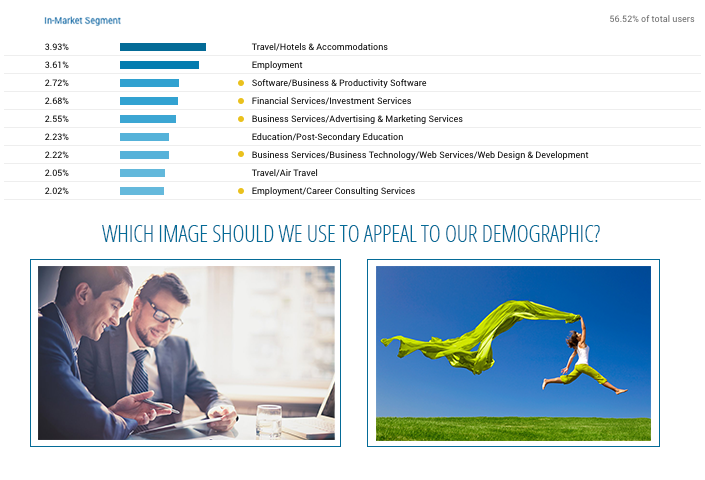
Digital Firefly Marketing loves data. Here’s a peek at some of our demographics:

Our demographic skews toward 35-45 years of age interested in tech and entertainment. What images would be most attractive to our audience?
Bounce Rate
One of the easiest ways to find out if your design is working is by taking time to look at Bounce Rate. This metric tracks the number of people who leave your site without clicking to another page. Take the time to look at pages with a high bounce rate and assess what it is that makes it easy to leave. Are you not using best practices of UI? Maybe you’re not using your knowledge of human psychology? Always consider:
- Can users immediately intuit what you want them to do?
- Are links to other pages above the fold and easy to find?
- Does the page have a clear, directed purpose?
One of the best ways to use this data to drive design is to compare your pages with the lowest bounce rates to those with the highest. What’s different? Apply the good stuff you’re doing in your low bounce rate pages to your high bounce rate pages and monitor progress. Here’s a pro tip: If you create a page that converts well, direct more of your traffic to it. Share links to the page on social media and be sure to include internal links from other pages on your website. The more visitors, the better the data you will get.
Mobile Traffic Stats
Responsive design makes having a mobile website easy in theory, but it’s trickier in practice. Always think about how your design will look on mobile and make sure to check your mobile analytics separate from your desktop analytics to address areas of trouble. Do you have a lot of mobile traffic, but very low conversions? Maybe your form has gone below the fold or the fields are too small. Maybe you haven’t implemented a click-to-call function. Remember, at the end of the day, the idea is to help users convert. Are you making it easy for them?
The first way to do this is to make sure that anything that needs to be clicked can be done so easily. Use a button, preferably. If you cannot use a button make sure that the hyperlinked text does not appear near anything else clickable. People get frustrated quickly when they can’t easily tap what they are trying to get to.
Another key to leveraging the use of mobile is to make sure your mobile site looks trustworthy. Use badges to show your site is virus-checked and secure and always include a click to call option. People feel better knowing they can contact you.
How To Grow Your Audience Using Analytics
When thinking about analytics, don’t just think about the numbers. While you should know how many people are coming to your site and when so that you can leverage this data, use it to drive your design and decision making.
Here’s what you should look at:
Where is traffic coming from? Are your visitors coming after seeing posts on Facebook? Or are your pay per click ads attracting them? How much is from organic search?
If it’s coming from FB you should focus more on imagery than layout.
Once you know who is coming to your website based on referrals and demographics figure out how to delight them. Design for each individual user using best practices and the type of images and layout that attracts them. We don’t want to be ageist, but consider this: if your site is about retirement planning, you might want the text to be larger. Close up vision sees significant decline from 41-60 so avoid the teeny tiny text if your visitors are in this demographic.
Who is your audience and who do you want it to be? Facebook users are skewed older than Instagram so think about that when you look at the data. If you’re targeting a younger demographic and everyone is coming from Insta it’s time to figure out how you can cast a wider net by appealing to the older crowd.
What do posts that work (and don’t work) have in common? Do you have two crazy high performing posts? And three that appear to have never seen the light of day? Analyze what they have in common and do more of what you did in the one everyone is flocking to. Ditch the habits you find you applied to the ones that aren’t generating traffic.
Is one style landing page performing better? A/B test which type of page layouts are attracting more visitors and getting more conversions. Use this to drive FUTURE designs.
Now that You’ve Got Them, How Do You Keep Them?
Increase Your Pages per Session With Clear Links
You’ve worked super hard to design a perfect landing page and it’s getting a lot of traffic. Now, how do you keep them from leaving at the end of the article? We like to use bold internal links to relevant articles.

Increase Your Conversion Rate With Better Forms
Seeing a lot of traffic, but a super low conversion rate? Your forms probably need some work! First, make sure your form is above the fold.
Next, does your form look like a form? Or does it get lost in the copy of the page? Don’t lose out on a conversion because your audience didn’t notice a form that blends in.
Be clear what the completing the form will provide the user, and test different versions with varied text in the fields and even the number of fields. Remember from last week: there is a point where too many fields make potential leads drop off.
Thank You Pages Keep Customers
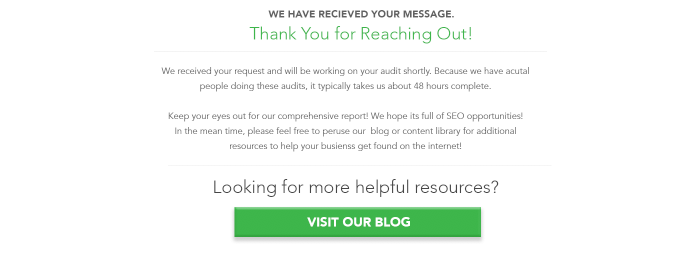
Great! You’ve got a lead. But it doesn’t have to stop there. Make sure you design thank you pages that show you’ve received their submission, and provide additional resources they can visit while you’re processing their request. Example?
Say you’ve requested our Free SEO audit. On our thank you page, we’ll provide you with some blogs we think you’ll find very helpful in your quest for understanding the importance of SEO on your digital marketing strategy.

It’s A Numbers Game
Analytics should be a regular part of your internal discussion. After all, the world’s most beautiful design doesn’t mean anything if it doesn’t resonate with your audience, communicate a clear message and make it easy for your user to convert. Interested in talking about your brand’s web design and learn how analytics can help improve your conversation rates? Get in touch with our design team; we’d love to geek out with you over the data.
